Quantitative Research: Icon Optimization
Background
At SpaceX, I worked with the software team that built the displays used while the rocket was on the ground. Operators used these interfaces to load propellant onto the vehicle and make sure all the systems were functioning properly before launch. One of the primary components used throughout these displays, was an icon that represented a valve. Some had as many as 20 individual valves.
These valve icons gave the operators information about the current state of any given valve. It used a combination of two colored lights to indicate if the valve was open, closed, in transit, or failed. The operator needed to know what each combination meant in order to understand what state each valve was in.

Problem Statement
Working with the operators of these displays, my team realized that there was an issue with how these valves were displayed. The problem statement we came up with was:
It takes too much work to interpret the state of each valve making the displays overall harder to use.
Hypothesis
The team created a new version of the icon which more directly indicated the state of the valve. The new icon was a simple circle with a line through it. When the valve was open, the line connected the pipe leading into the valve with the pipe leaving the valve. When the valve was closed, the line was perpendicular to these pipes. Our hypothesis was:
By indicating the state of the valve directly in the design of the icon, operators will be able to more quickly asses the state any given valve in their system.

The Study
My job was to objectively measure if the new valve display was effective at improving the speed at which operators could interpret the state of each valve. Because I was measuring time and expected a somewhat small overall effect, I needed a relatively large sample. I decided to develop a website using JQuery and MySQL that would run the study in an unmoderated fashion. I sent it to operators throughout the organization and they could complete the task when they had time.
The study was a within subjects design in which each participant completed a number of randomized trials using the original icon or the new icon. During a trial, the participant was asked to either open or close a specific valve within a realistic mockup of one of the displays. On some of the trials the valve was already in the state it was supposed to be in. This meant that participants would need to interpret the state of the valve prior to taking any action on it. On the trials in which the state of the valve needed be changed there was a chance it would fail in transit. Participants had to recognize the failure and indicate it through a key on their keyboard.
To test our hypothesis I measured how long it took operators to complete different portions of the trial:
Time to find and indicate the state of the valve
Time to recognize a failed valve
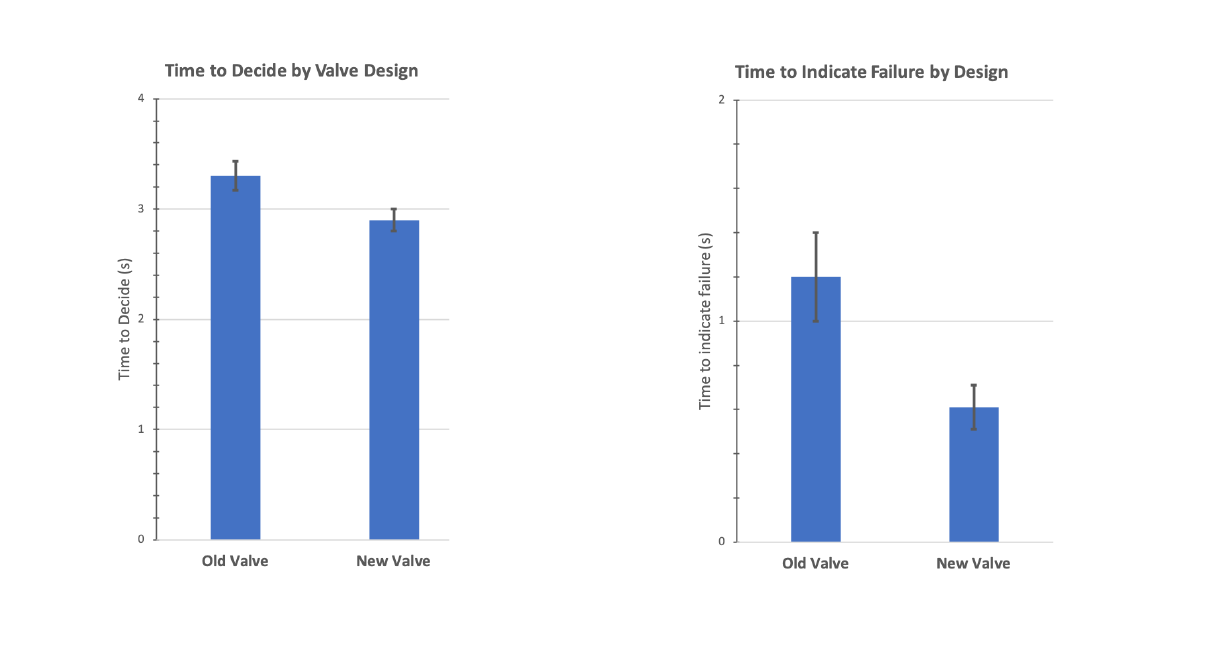
Results
The redesigned valve display significantly outperformed the original design leading to a reduction in the amount of time it took to identify the state of a given valve in the display. The biggest benefit of the new valve design however came from the increased ability of operators to quickly identify a failed valve.
Conclusion
The original design required additional cognitive load to interpret because the operators had to remember what each of the light combinations indicated. The new design removed the need for operators to know the light combinations because it showed the operator what the physical state of the valve was. It also had a much clearer error state. Based on the results of the study, the ground software team began implementing the new design across all of its interfaces.
Skills Used
Experimental Design
Prototyping
HTML/CSS
jQuery
MySQL
Statistical Analysis using R